
PRODUCT CENTER
Product Center
‹
›
‹
›
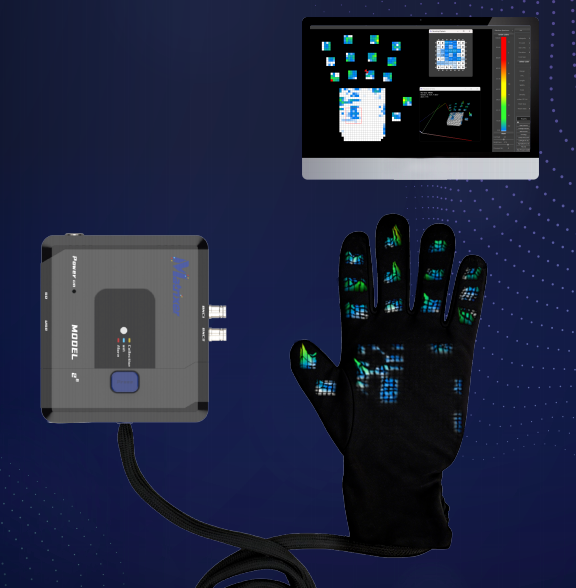
The system transmits pressure values and contactarea from each sensing unit in real time via wired orwireless connection. It enables precise calculationof overall average pressure, peak pressure, pressurevariation trends, and asymmetry in pressuredistribution, thereby achieving dynamic monitoringand quantitative analysis of contact pressurebetween the hand and key parts of the human body.Designed for research and laboratory settings, thesystem is suitable for fields such as ergonomics,sports science, rehabilitation medicine, wearabledevice research, and robotic tactile sensing,providing a reliable pressure distributionmeasurement solution for experimental datacollection, functional evaluation, and modelconstruction.
Product Introduction
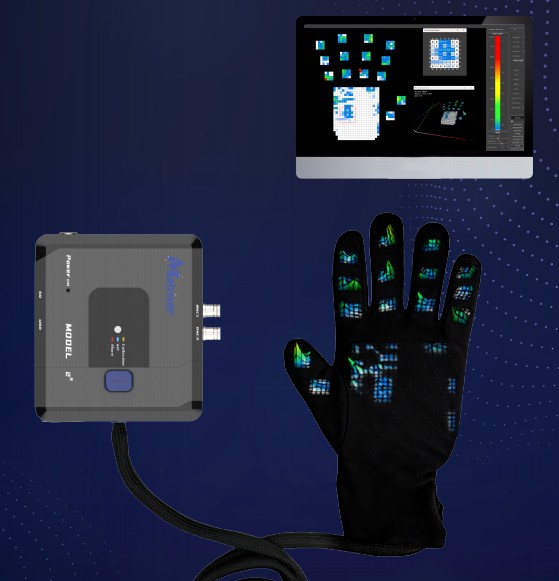
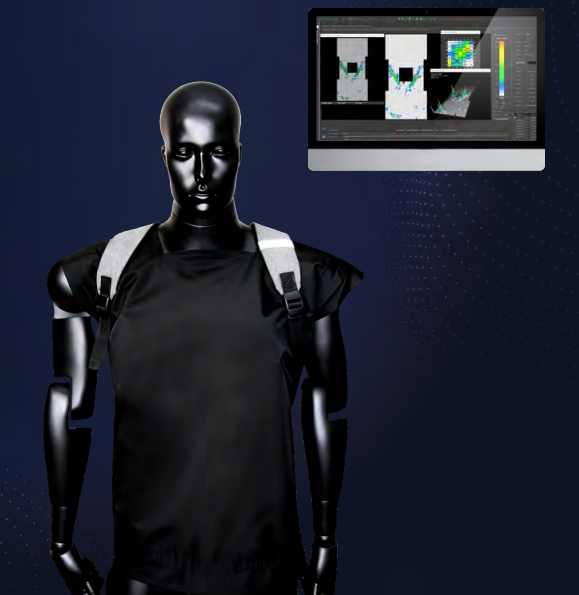
The system consists of a high-density flexible fabricpressure sensing array, a lightweight dataacquisition unit, and professional collection andanalysis software.
The system transmits pressure values and contactarea from each sensing unit in real time via wired orwireless connection. It enables precise calculationof overall average pressure, peak pressure, pressurevariation trends, and asymmetry in pressuredistribution, thereby achieving dynamic monitoringand quantitative analysis of contact pressurebetween the hand and key parts of the human body.Designed for research and laboratory settings, thesystem is suitable for fields such as ergonomics,sports science, rehabilitation medicine, wearabledevice research, and robotic tactile sensing,providing a reliable pressure distributionmeasurement solution for experimental datacollection, functional evaluation, and modelconstruction.
PRODUCT SPECIFICATIONS
COLLECTION ANALYSIS SOFTWARE
Real-time and accurateDataAcquisition
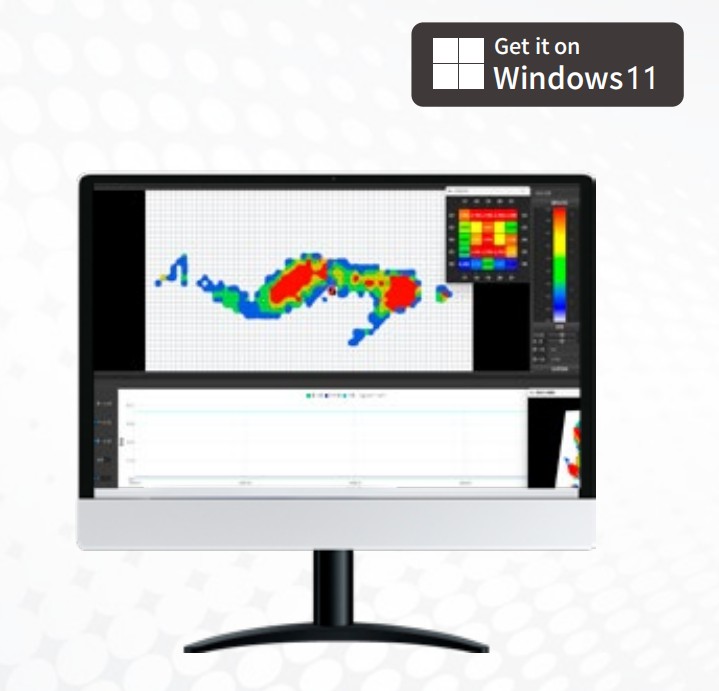
The software possesses high-performance processing capabilities, supporting synchronous acquisition and analysis ofmultiple sensors, achieving real-time pressure matrix monitoring and dynamic refresh recording of data from allsensing units. The system provides high-precision data display, with pressure values supporting precise readings up tofour decimal places. It can also count the number of effectively contacted sensing units and their specific pressurevalues in real-time, assisting you in instantly evaluating the uniformity of pressure distribution. Meanwhile, thesoftware supports flexible switching between various international standard mechanical units such as kg/cm3, kPa, andPSl, and allows one-click export of raw data in TXT/CSV formats for subsequent processing and archiving.
Intelligent Area Analysis and ProcessPlayback
The software provides powerful intelligent area analysis functions, allowing users to flexibly customize analysis areasaccording to testing requirements. The system will automatically calculate and output key parameters for each partitionper frame of data, such as average pressure, maximum/minimum pressure values, and contact area. Furthermore, the testprocess recording function can completely capture data throughout the entire testing cycle and supports quickplayback and precise positioning via an intuitive timeline, which enable you to easily trace back to any critical pressurechange node, meeting the needs of in-depth analytical research.
Intuitive Multi - dimensional DataVisualization
To transform data into intuitive insights, the software offers 2D/3D pressure cloud visualization solutions, usingindustry- standard color gradients to clearly map pressure levels. Simultaneously, the system can automaticallygenerate pressure vs. time curves, cearly presenting dynamic data history, and supports overlay comparative analysis ofmulti-channel data, providing you with comprehensive, graphical insights from static distribution to dynamic changes.
Professional Report Generation and In-depth Data Analysis
The software supports user-customized analysis reports and a comprehensive library of body pressure distributionmetrics. It can automatically calculate the following:Overall Metrics: Total pressure, Average pressure, Maximum pressure, Pressure standard deviation.Area Metrics: Total contact area, Contact area percentage.Balance Metrics: Pressure center (center of gravity) coordinates and trajectory, Left/right and front/rear balance ratiosRegional Metrics: Average pressure, Maximum pressure, and Load percentage for each partition.Users can flexibly select these metrics, combine them with pressure cloud maps and curve charts, to quickly enerateprofessional analysis reports in various formats with clear conclusions. This thoroughly resolves the challenges of datainterpretation and results presentation, significantly enhancing research, development, and evaluation efficiency.

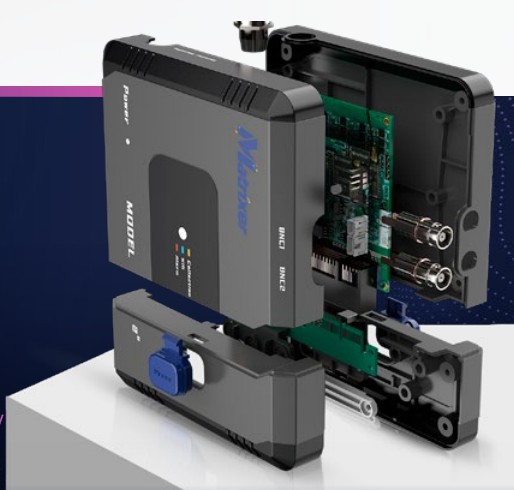
DATA RECEIVER
Resolution:12bit
Offline Storage:128GB
Power Supply:USB/Power Bank
Data Sync Interface:With the SynchronizedTrigger BNC Interface
Data Collection Modes:USB+W5iFi+ SD
Wired Frequency:0-200HZ (adjustable)
WiFi Frequency:0-100HZ (adjustable)
Offline Storage Frequency:0-200HZ (adjustable)

Related Product
Derect Contact with us